A quick turn analysis to visually compare events caused by the Glacial Lake Outburst Flood in the Indian Himalayan Region of Sikkim during early October of 2023.
Author
Vincent Clemson
Published
October 12, 2023
Modified
February 19, 2024
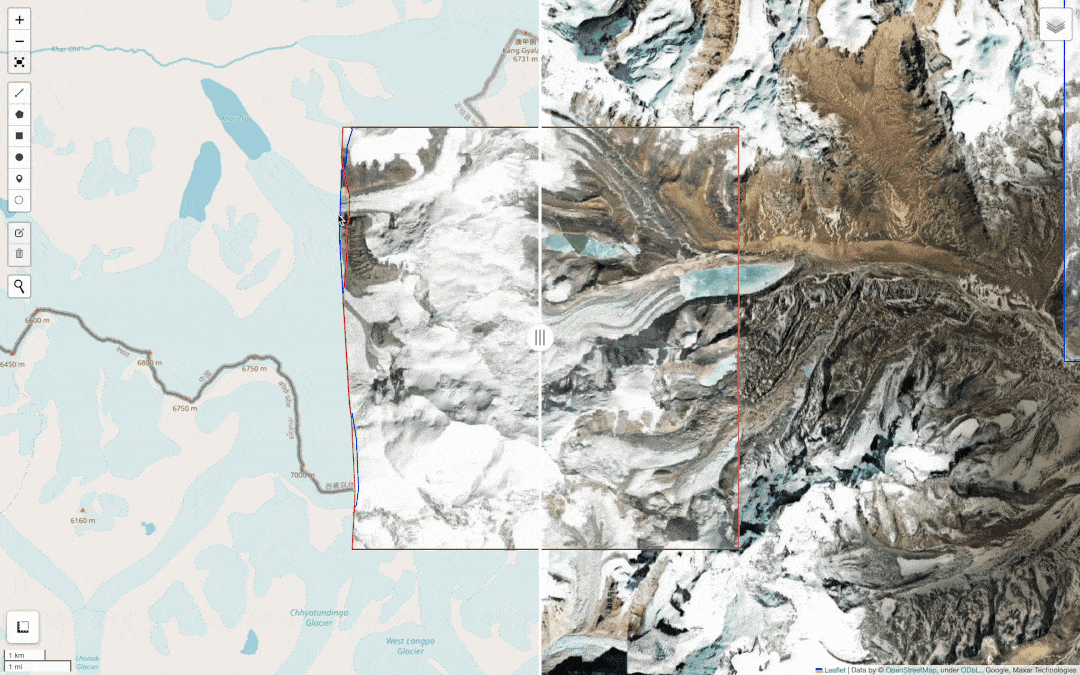
Figure 1: A split web map displaying avalanche damage to South Lhonak Lake (a glacier lake) in the Indian Himalayan Region. The pre & post event satellite imagery was obtained from Maxar’s Open Data Program.
TLDR
I quickly visualize Maxar’s recent release in response to the flooding events in the northern Himalayan region of Sikkim, India in October of 2023. Figure 4 displays a demo of this. You can use Figure 3 to interact with the web map for yourself.
My previous post is a technical deep dive that covers the tooling used behind these techniques.
Intro
On the morning of October 12th, 2023, Maxar released an activation alert within their Open Data Program on the recent flooding that devastated Sikkim, India in the Indian Himalayan Region last week on Wednesday October 4th. It has been reported that the flooding was caused by a Glacial Lake Outburst Flood (GLOF) from a melting glacier at South Lhonak Lake. Ultimately, the flooding triggered from the glacier lake area destroyed the Chungthang Dam and it’s surrounding town miles away downstream.
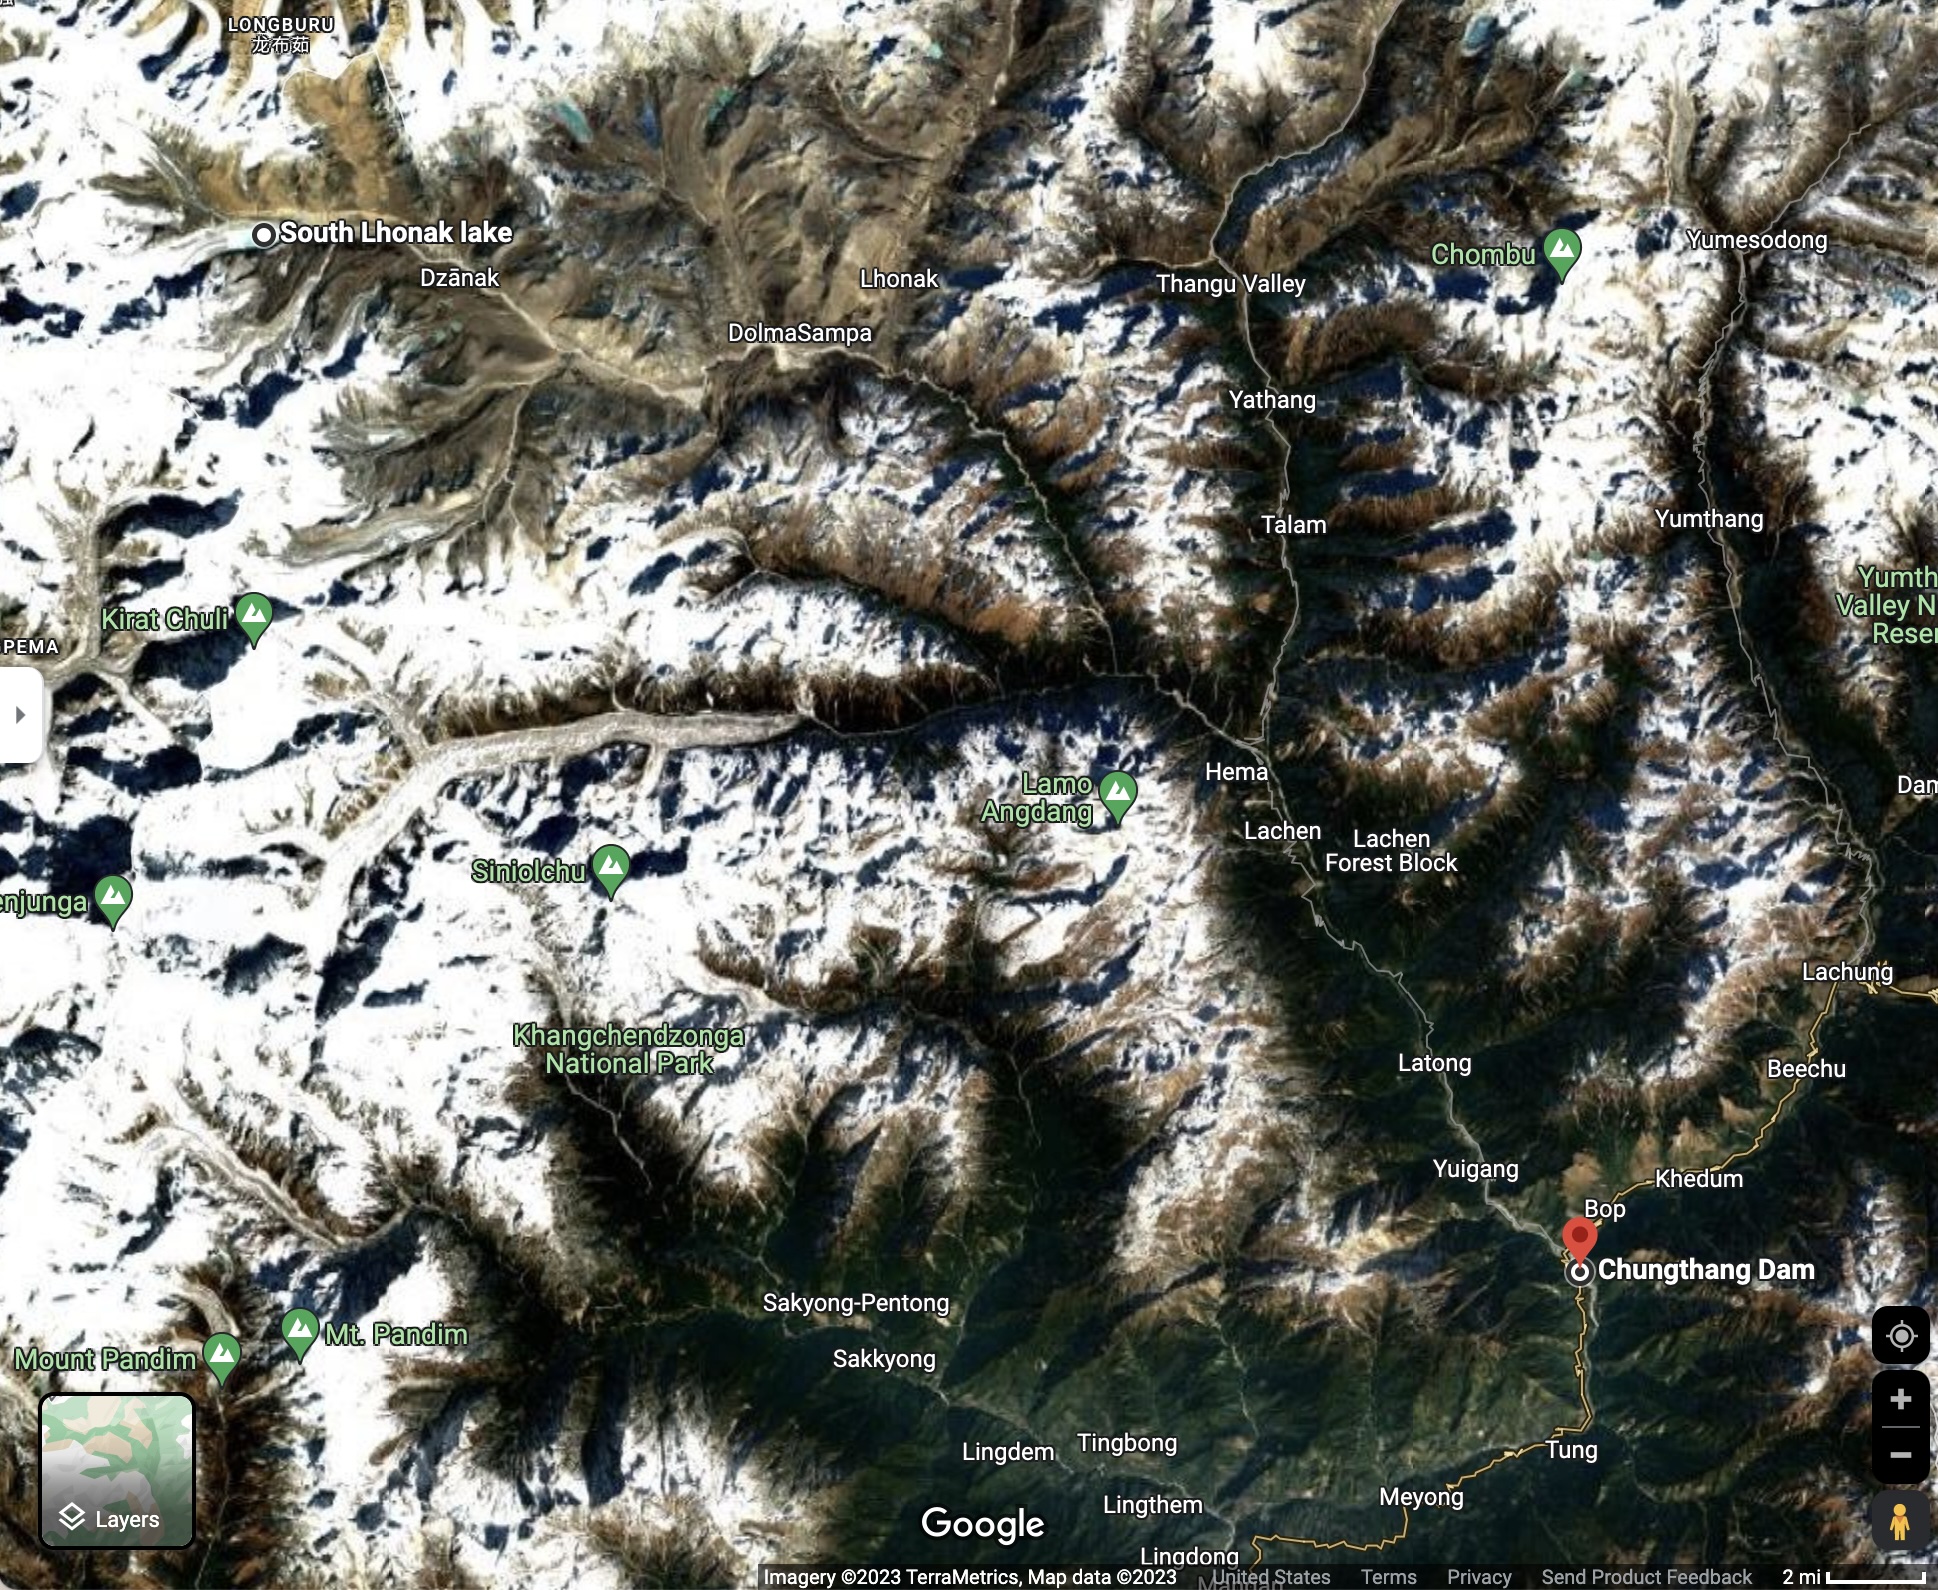
Figure 2: Google Maps view from South Lhonak Lake (upper left) to Chungthang Dam (bottom right). Source
Here I use open source technologies to build a web map that displays the released satellite imagery over the region. In particular, Figure 3 is a web map that showcases before and after the GLOF took place to help make visual comparisons of the disaster.
Additionally, Dan Shugar previously released an in-depth thread of the GLOF that triggered the flooding using Planet Labs imagery from the SuperDove satellites. It’s a great resource (below) to understand the chain of events that happened during the floods.
Data Aggregation
North India Flood Event Image Tile Aggregation - Maxar’s Open Data Program
import timeimport numpy as npimport pandas as pdimport geopandas as gpdstart = time.time()p_datasets ='https://raw.githubusercontent.com/opengeos/maxar-open-data/master/datasets.csv'd_maxar = pd.read_csv(p_datasets)p_top ='https://raw.githubusercontent.com/opengeos/maxar-open-data/master/datasets/'p_bottom ='.geojson'event ='India-Floods-Oct-2023'd_event = d_maxar[d_maxar.dataset == event]l_gdf = [gpd.read_file(p_top+d+p_bottom).assign(event = d) for d in d_event['dataset'].to_list()]d_tiles = (pd.concat(l_gdf, ignore_index=True))# changes column order - puts event & geometry firstd_tiles = d_tiles[d_tiles.columns[-2::][::-1].append(d_tiles.columns[:-2])]dict_event = {'India-Floods-Oct-2023': ['2023-10-04 00:00:00', 'https://www.maxar.com/open-data/india-floods-oct-2023'],}d_event = pd.DataFrame.from_dict(dict_event, orient='index', columns=['t_event', 'source'])d_event = (d_event .reset_index(names='event') .assign(t_event = pd.to_datetime(d_event.t_event, utc=True).to_list()) .sort_values('t_event', ascending=False) .reset_index(drop=True))# right join removes old datasets stored in opengeos/maxar-open-datad_tiles = pd.merge(left=d_tiles, right=d_event, how='right', left_on='event', right_on='event')d_tiles = d_tiles.assign(pre_post = np.where(d_tiles.datetime < d_tiles.t_event, 'pre', 'post'))d_tiles.insert(1, 'pre_post', d_tiles.pop('pre_post'))# sort by latest event date d_tiles = (d_tiles .assign(latest = d_tiles.groupby('event')['t_event'].transform('max')) .sort_values(['latest','datetime'], ascending=False) .drop('latest', axis=1) .reset_index(drop=True))end = time.time()print(str(round(end-start, 2))+' seconds')
0.29 seconds
Pre & Post Event MosaicJSON Creation
import osfrom cogeo_mosaic.mosaic import MosaicJSONfrom cogeo_mosaic.backends import MosaicBackendfor e in np.unique(d_tiles.event): start = time.time() d = d_tiles[d_tiles.event == e].reset_index(drop=True)# write output os.makedirs('data/'+e, exist_ok=True)for i in ['pre', 'post']: images = d[d.pre_post == i].reset_index(drop=True).visual.tolist()iflen(images) >0: mosaic = MosaicJSON.from_urls(images)with MosaicBackend('data/'+e+'/mosaic-tiles-'+i+'.json', mosaic_def=mosaic) as f: f.write(overwrite=True) end = time.time()print(e+' Pre/Post MosaicJSON Time: '+str(round(end-start, 2))+'s')
cols_tile = ['visual', 'tile:data_area', 'tile:clouds_area', 'tile:clouds_percent','view:off_nadir', 'view:azimuth', 'view:incidence_angle', 'view:sun_azimuth', 'view:sun_elevation','gsd', 'proj:bbox', 'quadkey', 'utm_zone', 'grid:code']# create bounding box from image footprint instead of thesecols_drop = ['proj:bbox', 'quadkey', 'grid:code']cols_tile_unique = ['utm_zone', 'tile:clouds_area']cols_tile_mean = ['gsd', 'tile:clouds_percent', 'view:off_nadir', 'view:azimuth', 'view:incidence_angle', 'view:sun_azimuth', 'view:sun_elevation']cols_tile_footprint = ['event', 'pre_post', 'catalog_id']d_agg = (d_tiles[cols_tile_footprint+cols_tile_unique] .groupby(cols_tile_footprint) .agg({'utm_zone': lambda x: np.unique(x).tolist(),'tile:clouds_area': lambda x: round(sum(x), 2), }))d_agg_mean = (d_tiles[cols_tile_footprint+cols_tile_mean] .groupby(cols_tile_footprint) .agg(lambda x: round(np.mean(x), 2)))d_foot = (d_tiles[d_tiles.columns.difference(cols_drop+cols_tile_unique+cols_tile_mean).to_list()] .dissolve(cols_tile_footprint, aggfunc ='first')# same index - can left join aggregates on index by default .join(d_agg).join(d_agg_mean)# add index back to dataframe .reset_index())# split because `d` carries from original when chainingd_foot = (d_foot .assign(# uses equal area projection - converts km^2 original units footprint_data_area =lambda d: round(d.geometry.to_crs(epsg=6933).area/1e6, 2), bbox = d_foot.geometry.bounds.applymap(lambda x: round(np.mean(x), 2)).values.tolist() ) .sort_values(['t_event', 'datetime'], ascending=False) .reset_index(drop=True) .rename(columns={'tile:clouds_area': 'footprint:clouds_area', 'tile:clouds_percent': 'footprint:clouds_percent','footprint_data_area': 'footprint:data_area' }))
Analysis
We see that there are currently 5 images acquisitions (image footprints) released from before the flooding and 1 image acquisition taken after the flooding.
import reimport leafmapimport leafmap.foliumapfrom folium import Elementfrom leafmap2 import add_geojson2, add_gdf2leafmap.foliumap.Map.add_geojson2 = add_geojson2leafmap.foliumap.Map.add_gdf2 = add_gdf2# 'p' for path | 'm' for mosaic | 'f' for footprintevent ='India-Floods-Oct-2023'pm_top ='https://raw.githubusercontent.com/prncevince/mosaicjson-examples/main/maxar-open-data/'pm_end_pre ='/mosaic-tiles-pre.json'pm_end_post ='/mosaic-tiles-post.json'cols_drop = ['source', 'proj:epsg', 't_event']d = d_foot[d_foot.event == event]d.drop(cols_drop, axis=1, inplace=True)m = leafmap.foliumap.Map()def style_footprints(color, fillOpacity, weight): style = {'color': color, 'fillOpacity': fillOpacity, 'weight': weight }return stylebasemap = { "url": "https://mt1.google.com/vt/lyrs=s&x={x}&y={y}&z={z}","attribution": "Google","name": "Google Satellite",}m.add_tile_layer(**basemap, shown=True)m.add_stac_layer(pm_top+event+pm_end_pre, name="Pre-Event - Mosaic", attribution="Maxar Technologies", shown=True)m.add_stac_layer(pm_top+event+pm_end_post, name="Post-Event - Mosaic", attribution="Maxar Technologies")m.add_gdf2( d[d.pre_post =='pre'], "Pre Event - Image Footprints", style=style_footprints('blue', 0, 1.5), info_mode='both', tooltip_fields_remove=['visual'], kwargs_tooltip={'sticky': False})m.add_gdf2( d[d.pre_post =='post'], "Post Event - Image Footprints", style=style_footprints('red', 0, 1.5), info_mode='both', tooltip_fields_remove=['visual'], kwargs_tooltip={'sticky': False})withopen('./popup-fix.js') as f: js_po = f.read()withopen('./side-by-side.js') as f: js_sbs = f.read()withopen('./split-map-layout.css') as f: css_sbs_l = f.read()withopen('./split-map-range.css') as f: css_sbs_r = f.read()#with open('./split-map.js') as f: js_sm = f.read()# must render 1st to add script after - otherwise adds JS before Leaflet L.Map assignmentm.get_root().render()# add map & geojson layer variables to scriptvar_map = m.get_name()var_geojson_lgs =str([i for i in m._children.keys() if re.search('^geo_json_', i) isnotNone]).replace("'", "")tile_layers = [i for i in m._children.keys() if re.search('^tile_layer_', i) isnotNone]# need to know the order of your tiles for adding as split map# an area of multiple layers can be passed to left & right arguments of L.control.sideBySide# however, it's pretty buggy when passing more than one layeri_all = [0,1,2] # a basemap, pre, & post eventi_left = [2]i_right = [0]l_lleft =str([j for i, j inenumerate(tile_layers) if i in i_left]).replace("'", "")l_lright =str([j for i, j inenumerate(tile_layers) if i in i_right]).replace("'", "")m.get_root().header.add_child(Element('<style>'+css_sbs_l+'</style>'))m.get_root().header.add_child(Element('<style>'+css_sbs_r+'</style>'))m.get_root().script.add_child(Element(js_po.format(m=var_map, lg_geo=var_geojson_lgs)))m.get_root().script.add_child(Element(js_sbs))m.get_root().script.add_child(Element('L.control.sideBySide({l_lleft}, {l_lright}).addTo({m});'.format(l_lleft=l_lleft, l_lright=l_lright, m=var_map)))
If you have any thoughts or questions, feel free to let me know what you think in the comments below. You’ll need to sign in to your GitHub account to do so. Like my work? Feel free to reach out.
We only have one rock, and it’s a beautiful one. Thanks for reading! ✌️🌍
Figure 4: 2023 South Lhonak Lake Sikkim, India - Maxar Open Data Program Leaflet Split Map